Modules · Event management: monitoring alerts

Less noise, incidents already qualified.

Ecaldima receives alerts from your monitoring tools, groups them, links them to CMDB items and opens only the incidents that deserve it. It does not replace your monitoring: it connects what monitoring sees to the Service Desk’s work.

Request a demonstration Download the sheet

  • Deduplicated alerts
  • Silence during changes
  • Every decision explained

01Live

A console where every alert is already linked to its item.

Real-time updates, filters by status, severity, source and text; repeated alerts are grouped into one, with their count. An alert can be acknowledged, resolved or dismissed with a reason.
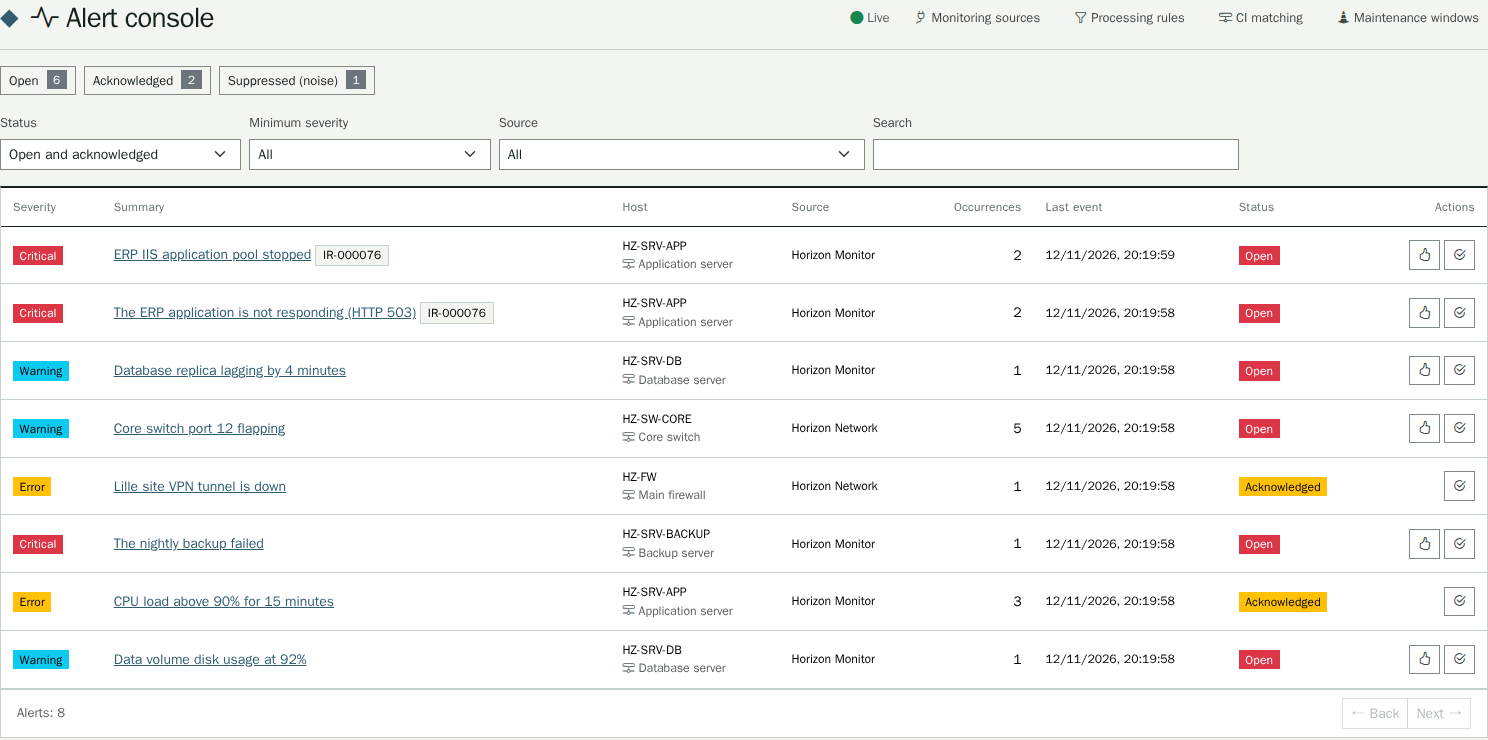
A console where every alert is already linked to its item.

02Your rules

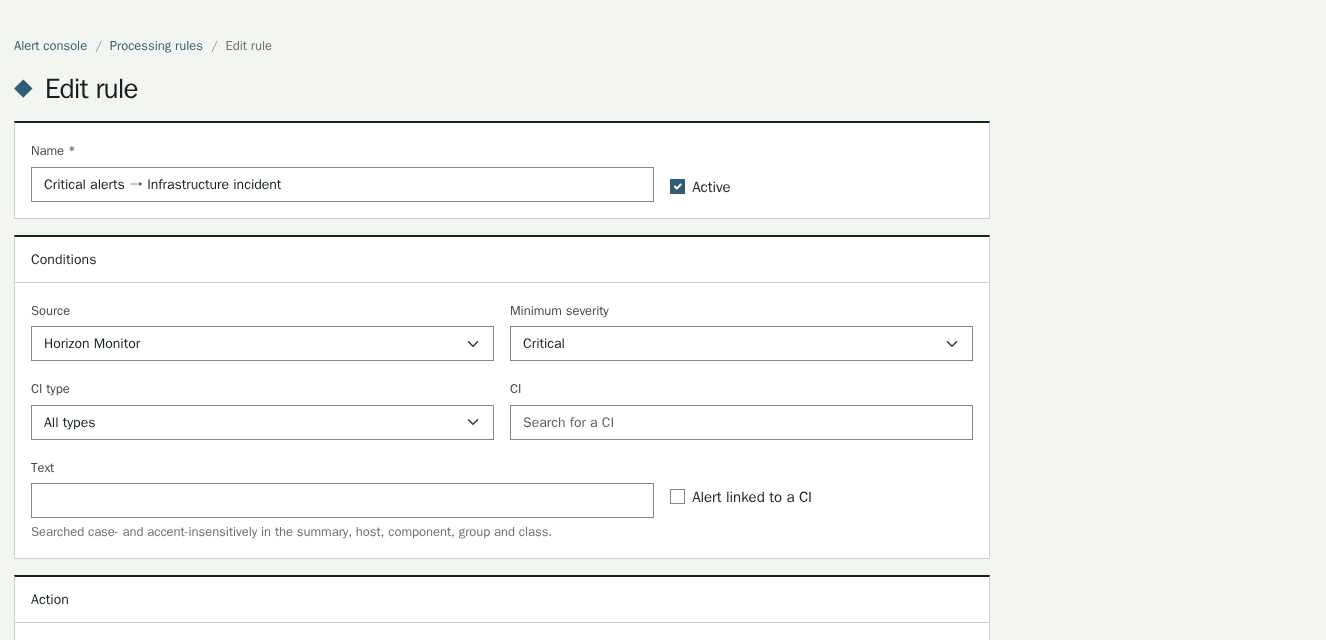
Only alerts that need action open an incident.

Ordered rules ignore, log, notify or open the incident, already linked to the item with its category, priority and group. A seven-day simulation shows their effect before you activate them.

Only alerts that need action open an incident.

03During an intervention

A planned change does not trigger false alerts.

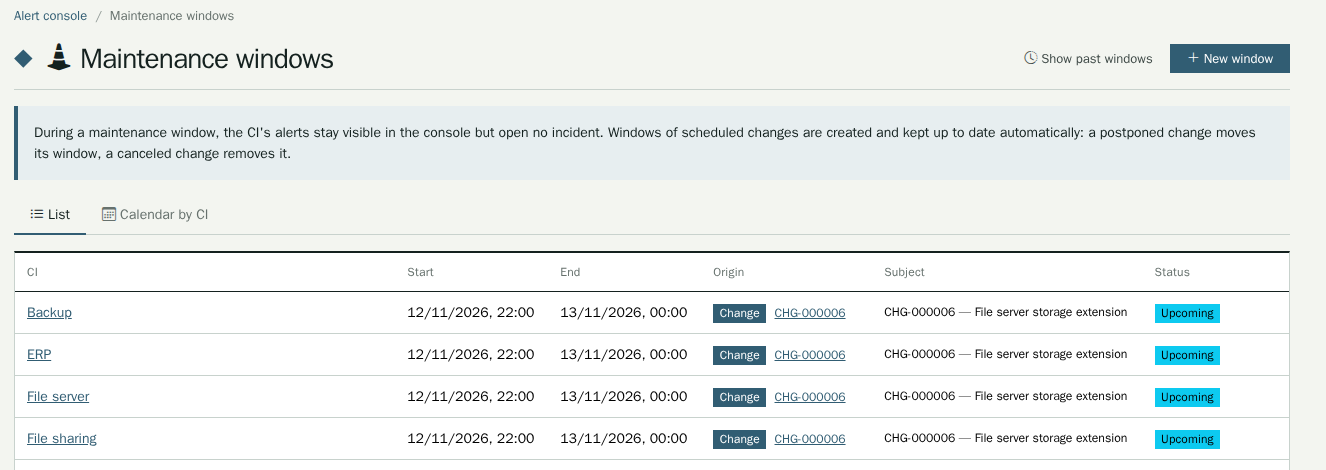
An approved or scheduled change creates a maintenance window for each affected item, which follows its postponements and cancellation: alerts stay visible but open no incident.

A planned change does not trigger false alerts.

The right person notified, once.

The group, or just its on-call person, is notified in their own language, once per alert. When all of an incident’s alerts clear, the incident moves to Resolved.

Your tools, as they are.

Zabbix, Centreon, PRTG, Nagios, Datadog and others natively emit the PagerDuty Events v2 format; Prometheus Alertmanager, Azure Monitor and CloudEvents are read as they are, and a custom format is described by field mapping.

I’m blown away!

A customer who has used Ecaldima since its early days, after the demonstration of the new version

Related modules

Functional scope Every detail of the module
  • Sources and formatsPagerDuty Events v2 format, sent by Zabbix, Centreon, PRTG, Nagios, Datadog and others; Prometheus Alertmanager, Azure Monitor, CloudEvents, and free mapping tested on a sample; maximum rate per source, key never stored in clear.
  • Alert consoleReal-time updates, filters by status, severity, source and text; an alert is acknowledged, resolved or set aside with a reason.
  • DeduplicationSame source and same key: a single alert, whose count, last date and highest severity change; it reopens if the alert returns shortly after being resolved.
  • Linking to itemsRules by host name, IP address, external identifier or field value; an ambiguous match links nothing and is flagged.
  • Processing rulesConditions on source, severity, item type or item, and text; occurrence threshold, grouping by item, mapping between severity, impact and urgency, automatic resolution.
  • Maintenance windowsKept up to date from changes, or entered by hand for an item and its neighbours; list and calendar by item.
  • NotificationsA group or its on-call person, through the bell and e-mail, in each person’s language; none during maintenance.
  • Oversight“Related alerts” panels on the ticket and on the item’s record; widgets for active alerts, filtered noise and the noisiest items; report of open alerts.
  • Major incidentWhen many items raise an alert within a few minutes, the console suggests declaring a major incident.
  • Optional artificial intelligenceMatching alerts with the same cause, summarising a burst for the incident, suggesting rules against noise; AI proposes, the operator decides, and a match can be undone. Without AI, the whole module works.
  • ReliabilityEach event is recorded before the tool gets its response, then processed only once and in the order received.

Integrations

  • Tools compatible with PagerDuty Events v2: Zabbix, Centreon, PRTG, Nagios, Datadog…
  • Prometheus Alertmanager and Azure Monitor
  • CloudEvents 1.0 and in-house formats, through field mapping
  • Service Desk and its on-call schedule
  • CMDB repository and change management
  • AI assistance features, when the AI module is configured

Prerequisites

  • A monitoring tool able to send its alerts by webhook
  • The monitored items, present in the CMDB for linking
  • A service account, as requester of the incidents opened by rules
  • The groups to notify and, if needed, their on-call schedule

The essentials of this page in PDF, to keep or pass on.

Download the sheet

Want to see this module on your own processes?

We will build the demonstration around your operational reality.

Request a demonstration